


May 8, 2023
Please note that this submission represents the views of the Go8 and individual member universities may wish to make their own submissions. The Go8 also consents to this submission being made public.
Introduction
The Group of Eight (Go8) welcomes the opportunity to provide this submission to the Productivity Commission Review of Philanthropy. The Go8 represents Australia’s eight leading research-intensive universities who spend $7.7 billion on research each year (which is around 61 per cent of the sector’s total research expenditure).
The Go8 universities also educate more than 425,000 students each year. The Go8 universities are recipients of philanthropic contributions and are all active in philanthropic fundraising.
However, while financial philanthropic contributions are important and much welcomed, they remain a relatively small component of revenue for Australian universities. Unlike comparable nations there is not a strong culture in Australia of university alumni “giving back”.
- As a share of total revenues from continuing university operations, philanthropy has declined from a peak of 2.96 per cent in 2011 to 2.24 per cent in 2021.
- The share of Australian taxpayers with $1+ million taxable income claiming any philanthropic donation has decreased from 62 per cent in 2010‑11 to 53 per cent in 2019–20.
Compared to the United States, this is a very low level of philanthropic contribution. For Australian universities, the different giving culture is clearly detrimental because the benefits of stronger university philanthropy include better facilities and resources for students.
Yet we live in a world where philanthropy (not just to universities) is an important element of a civil society. It is a much-valued contribution to the community.
The philanthropy that is received by Australia’s universities enables them to expand research, education, and broader community activities, including supporting students to achieve.
The Go8 therefore supports the Government’s commitment to double overall philanthropic giving by 2030. According to Social Ventures Australia, the total amount of philanthropic giving in Australia is estimated to be $15.2 billion in 2018-19.[1]
During the same period, Australian universities received philanthropic revenue through donations, bequests, scholarships, prizes, and non-government grants totalling around $800 million. This is 5.3 per cent of the estimated total of philanthropic giving.
The Go8 universities do receive a significant share of the philanthropic contributions to the higher education sector. However, this represents a relatively small component of revenue and as a share of total revenues from continuing operations, has declined from a peak of 2.96 per cent in 2011 to 2.24 per cent in 2021.
Go8 Review recommendations
The Go8 makes four recommendations to enhance philanthropic activity for both Australian universities and for the community:
1. Support via Government matching of private philanthropy contributions.
2. Enhancements to the regulatory and broader taxation settings (as seen overseas) for philanthropy to increase its attractiveness to potential donors
3. Support for Australian universities’ philanthropy through enhanced funding of university R&D (given philanthropy to universities is more concentrated in supporting research).
4. A national philanthropy awareness campaign.
An overview of (financial) philanthropy to universities[2]
Size and types of (financial) philanthropic contributions
| The Go8 universities receive a significant share of the total financial philanthropic contributions to the higher education sector. However, these contributions are a relatively small component of revenue. These contributions to universities tend to be concentrated on donations and bequests and non-government grants rather than scholarships and prizes. |
While the Productivity Commission notes that there is no one definition of philanthropy, Philanthropy Australia’s (PA) definition is “the giving of money, time, information, goods and services, influence and voice to improve the wellbeing of humanity and the community.”[3]
Despite this broad definition data gaps make it difficult to discern the full extent of philanthropy in Australia.
The Department of Education does provide an indication of the size of financial philanthropy to Australian universities.[4]
Chart 1 shows that in 2021, 39 higher education institutions received $858.6 million in donations and bequests; scholarships and prizes; and non-government grants, with the Go8 universities receiving $644.5 million of this (or 75 per cent). However, this amounts to only 2.24 percent of total revenues from continuing operations.
Chart 1: Philanthropic related revenue – Australian higher education institutions, 2021 ($ million)
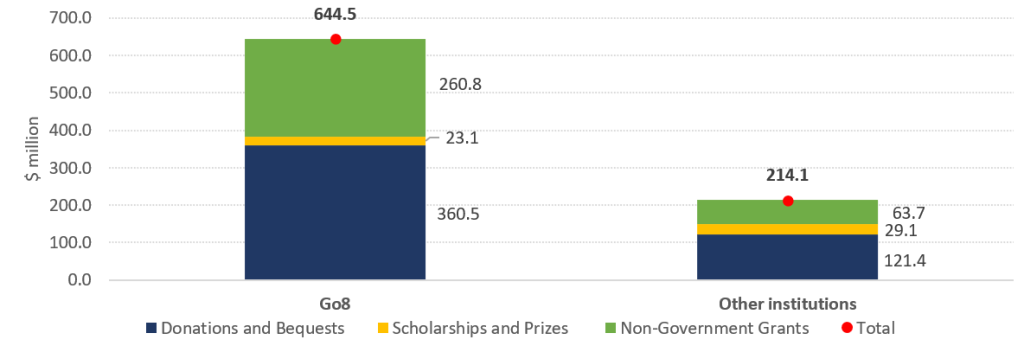
Source: Department of Education, Higher education providers finance tables, adjusted statement of financial performance, various years.
Sources of philanthropic contributions
| Trusts and foundations are a key source of financial philanthropy across the higher education sector despite survey data indicating a drop in the relative importance of this source for the Go8 in 2021. Alumni, other individuals, and corporates are a relatively more important source for the Go8 compared to other higher education institutions. |
Australian universities receive philanthropic contributions from:
- Individuals, including alumni and including donations, bequests, and gifts-in-kind: Go8 universities have charity status under the Australian Charities and Not-for-Profits Commission (ACNC) and deductible gift recipient (DGR) status under the Australian Taxation Office (ATO), so can receive donations that are tax deductible.
- Trusts and foundations: these hold, invest and distribute money from donors, including through structures such as Public Ancillary Funds (raising funds from the public) and Private Ancillary Funds (focused on individuals, families, or organisations).
- Corporates and other organisations: evidence suggests that larger Australian businesses mostly support education and research, with smaller businesses supporting culture and recreation.[5]
Unfortunately, the published financial statements data does not have sufficient detailed granularity to distinguish sources of contributions. In 2021 the Council for Advancement and Support of Education (CASE) surveyed 27 higher education institutions across Australian and New Zealand, including Go8 universities, and found:
Trusts and foundations account for 36 per cent of the mean of new funds secured across all the higher education institutions (27 per cent for the Go8, and 56 per cent for non Go8 institutions)[6]
- Other individuals account for 22 per cent of the mean of new funds secured across all the higher education institutions (25 per cent for the Go8).[7]
- Alumni account for 17 per cent of the mean of new funds secured across all the higher education institutions (22 per cent for the Go8, and only 6 per cent for non Go8 institutions).[8]
- This reflects the relatively strong alumni source for Go8 universities relative to other universities. The median alumni donors as a percentage of total donors was 55 per cent for the Go8, compared with 38 per cent for non Go8 institutions.[9]
- Together corporates and other organisations accounted for around 15 per cent of new funds secured in 2021 across the 27 higher education institutions (26 per cent for the Go8 universities).
Fundraising and investment in alumni relations
| Within the higher education sector, the Go8 universities invest more in fundraising and alumni relations and have achieved a higher return on these activities in terms of new funds sourced. |
Fundraising by universities underpins and augments the sourcing of philanthropic contributions. According to CASE (2022), the Go8 universities invest relatively more in alumni relations, including staff. In 2021 the median number of alumni relations staff was 21 at Go8 universities, compared with four for non Go8 universities.
Trends and motivations for giving to Australian universities.
| Revenue from donations and bequests as a share of operating revenues has risen only slightly over time – from 1.1 per cent in 2008 to 1.3 per cent in 2021. Revenue from scholarships and prizes as a share of operating revenues has fallen from an existing low: from 0.26 per cent in 2008 to 0.14 per cent in 2021. Revenue from non-government grants as a share of operating revenues has fallen from 1.29 per cent in 2008 to 0.85 per cent in 2021. In the United States, higher education institutions have, on average, higher philanthropic contributions as a share of operating revenue compared to both Australia and the UK. |
Chart 2 shows the trend in overall philanthropic revenue to universities as a percentage of total revenues from continuing operations.
Chart 2: Philanthropic revenue as share of total revenues from continuing operations, per cent
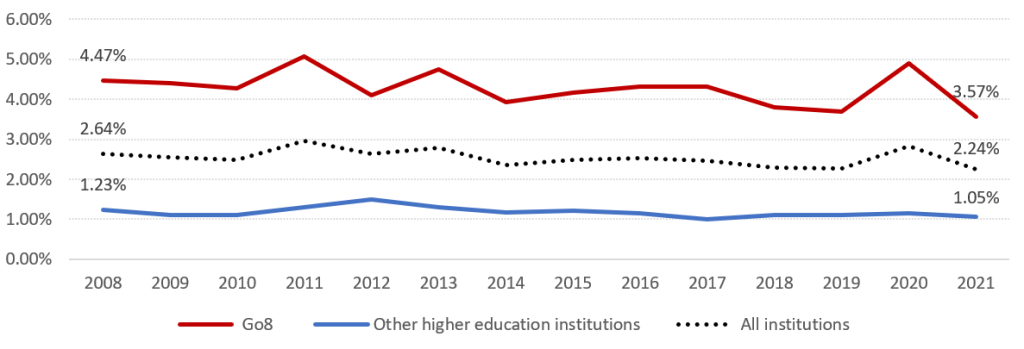
Source: Department of Education, Higher education providers finance tables, adjusted statement of financial performance, various years.
International comparisons of giving to universities
The chart below shows higher education philanthropic revenue as a share of operating revenue for Australia, the United States, and the UK.
The comparison is approximate and indicative because of the difficulty sourcing comparable data including for the treatment of ‘grants’ revenue in each nation (particularly for the UK series in the chart).
However, the United States stands out, with average public higher education institution philanthropic revenue as a share of operating revenue at 5.5 per cent in 2020 (note this is an average across over 1,000 public institutions – some individual private not-for-profit universities have much higher shares).
This is higher than both Australia and the UK, which are comparably similar.
Chart 4: Higher education institutions philanthropic revenue as a share of operating revenue, per cent
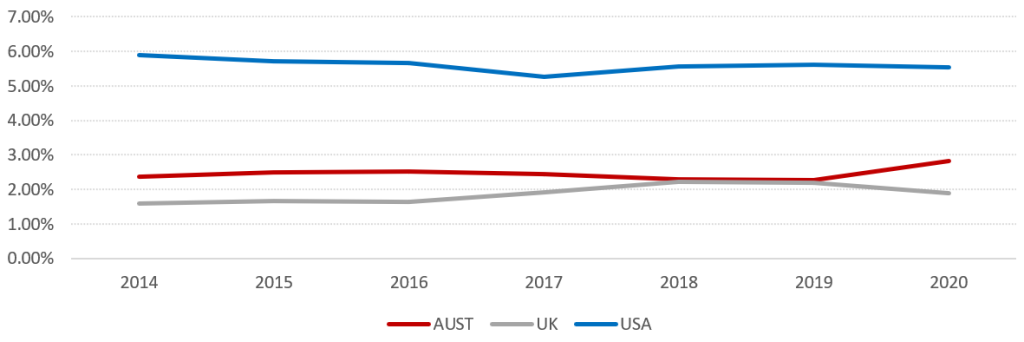
Sources: Australia – Data from the Department of Education, Higher education providers finance tables, adjusted statement of financial performance, various years, for 39 institutions that include the Go8 universities and are those under Table A of the Higher Education Support Act 2003 (HESA). UK – Data from Higher Education Statistics Agency, Income of HE providers by location, category and academic year, https://www.hesa.ac.uk/data-and-analysis/finances/table-1. USA – Data from U.S. Department of Education, National Center for Education Statistics, Integrated Postsecondary Education Data System for degree granting institutions, Revenues of public postsecondary institutions using GASB standards, by degree-granting status and source of funds. For comparability, the USA data includes only public degree granting institutions. https://nces.ed.gov/ipeds/TrendGenerator/app/build-table/6/13?rid=2&ridv=1&cid=25.
The comparison of financial philanthropy to universities can be seen to mirror Australia’s relative international performance in total philanthropy.
According to Philanthropy Australia, total giving in Australia in 2016 was 0.81 per cent of GDP, well below the United States (2.1 per cent), the UK (0.96 per cent) New Zealand (1.84 per cent) and Canada (1 per cent).[10]
Motivations for giving to universities.
| The motivations for giving are broad and they encapsulate psychological, socioeconomic, and external factors. Philanthropy therefore cannot be considered solely as an economic transaction.Philanthropic support for universities tends to be directed to research.For Go8 universities, some 10.3 per cent of their annual total R&D income is sourced from (mainly domestic) philanthropy, compared with 3.4 per cent for the rest of the sector.Given the broad range of motivating factors, to achieve the Australian Government target of doubling philanthropic giving by 2030 will require a mix of policies to influence behavioural and financial incentives to donate. |
Philanthropy generally, and for universities specifically, can be motivated by several factors. These include altruism, reputation, and psychological benefits, including from bequests. Factors such as age, income, participation and satisfaction with the university, and perceived prestige are positively associated with philanthropy.[11] [12]
External factors such as tax and grants settings and degree of public funding of universities are also suggested as potential factors.
Philanthropic support for universities tends to be directed to research. For example, the CASE (2022) survey data for 2021 indicates that, as a share of the average of new funds secured in 2021, for all institutions in the sample, more than half of the funds were restricted for research programs and partnerships.[13]
The share of philanthropic contributions in research and development (R&D) income for universities also vary. Chart 5 shows that for the Go8 universities, around 10 per cent of our total R&D income is sourced from domestic philanthropy. Another 0.3 per cent comes from international philanthropists.
Chart 5: Share of philanthropy contributions to total R&D income for different higher education institutions, per cent
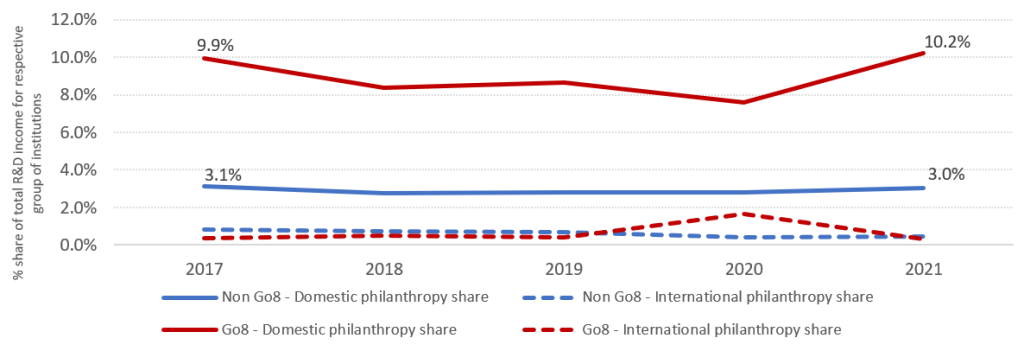
Source: Department of Education, Research income time series. https://www.education.gov.au/research-block-grants/resources/research-income-time-series
Opportunities for, and obstacles to, increasing philanthropic giving to Australian universities.
There are opportunities to increase philanthropic giving in Australia given Australia’s philanthropic performance relative to GDP is lagging the United States, UK, New Zealand, and Canada.
The aging of the Australia’s population presents an opportunity given older people tend to be more active in philanthropy.
For example, the Australian Institute of Health and Welfare found that, in examining tax deductible donations, the average amount donated increased with age (people under 18 claimed less than $100 whereas those aged 70 and over claimed more than $4000).[14] According to Philanthropy Australia, there is opportunity to increase philanthropy through structured entities and bequests and superannuation.
This is not to underplay the importance of younger generations whose awareness of and attitudes to philanthropy will determine whether Australia’s philanthropic performance can improve over time.
Higher education participation and attainment:
- Domestic students/alumni – In 2023 there are more university alumni who could potentially become greater philanthropic donors. The challenge is to ensure they are motivated to give back because they are engaged and satisfied with their university experience.
- International students/alumni – the number of international students at Australian universities has grown markedly over recent decades. These graduates are another potential source of additional philanthropy. Currently for the Go8 universities, while some 10 per cent of total R&D income is sourced from domestic philanthropy, only 0.3 per cent comes from international philanthropy. To change this, Australian universities must continue to invest in international alumni relations.
Wealth accumulation and transfer:
- Australia is a wealthy nation and there is a relatively (per capita) large pool of potential donors. Research by the Centre for Social Impact indicates Australia has one of the largest wealthy populations in the world on a per capita basis with one in 11 people with over AUD $1.5 million in wealth.
- Despite some high-profile philanthropic contributions from high wealth individuals (for example, in 2013 Nicola and Andrew Forrest donated $65 million to the University of Western Australia), almost half of the top one per cent and top five per cent of income earners in Australia did not report any philanthropic donations (to any cause) in 2018‑19.[15] [16] Moreover, the share of taxpayers with $1+ million taxable income claiming a donation has decreased from 62 per cent in 2010‑11 to 53 per cent in 2019–20.
Centre for Social Impact research suggests that extending pledges to give one per cent of wealth to all Australian households whose net wealth is above $50 million could raise overall philanthropic giving by over $8 billion.[17]
Regulatory and taxation settings
- Regulatory settings can influence the transaction costs of philanthropic giving, and taxation and other settings can influence the “price” (or “out-of-pocket” cost) to a donor. [18]
- Contrasting the United States to Australia and the UK, there is a greater prevalence of Government programs and tax incentives in the US that contribute to philanthropic giving more generally and to universities specifically. These include matched funding programs where the Government contributes an equal amount.[19] Matched funding programs for universities also exist in Canada, Singapore, and other jurisdictions.
- In addition, in the United States there has been a longer history of Government philanthropy schemes (‘planned giving vehicles’) relative to giving in Australian and the UK.[20] These schemes provide better tax incentives and relief relative to Australia and the UK.
- Another regulatory and taxation setting that influences philanthropy relates to timing of tax deductibility claims for donations. Evidence suggests that the length of time it takes from action to benefit does matter. Reforms in the Canadian province of Quebec to reduce the time before donations could be claimed, resulted in a significant increase in philanthropy compared to other provinces.[21]
Culture of giving:
- Australians tend to regard themselves as generous when it comes to charitable causes. This is demonstrated through generous donations to natural disaster relief and humanitarian crises. However, it is also arguable that due to a cultural disposition toward privacy and a reluctance to celebrate wealth or individual achievement, Australia does not have a strong culture of philanthropy”.[22] This is in contrast to the United States where the culture of philanthropy, including to universities is stronger.
- For Australian universities, an obstacle to increasing philanthropy is a view that universities are the responsibility of the Government and therefore it is Government that should provide them adequate funding.
The need for increased philanthropy information and education:
- There is more information available now on philanthropic causes than ever before, and this should assist people to make informed choices about giving. Yet many people have a limited understanding of philanthropic vehicles and tax deductions, such as Public Ancillary Funds or Private Ancillary Funds.[23] International evidence suggests that donors tend to underestimate the (subsidy) value of tax deductions.[24]
- At the same time, some philanthropic industry participants have raised concerns about “donor fatigue” – that possibly “too many causes would lead to donors being overwhelmed and disillusioned.”[25]
Technologies:
- New technologies such as the internet, crowdfunding platforms and social media have improved the access and ease by which people can participate in philanthropy.[26] It is anticipated that this could facilitate greater levels of philanthropic giving but data on the share of philanthropic contributions made through online platforms is scarce.
Recommendations to respond to these opportunities and obstacles.
- Support for Australian universities philanthropy through the matching of private contributions
Matching contributions/funding for private philanthropy reduces the effective price for donors and can boost giving.[27] The Australian Government already allows for tax deductibility for donations to DGRs such as universities. This should be augmented with the introduction of an Australian Government matching contributions scheme for private philanthropy towards Australian universities.
Matching funding programs for universities have been successfully applied in the US, Canada, Singapore, and other jurisdictions. Matching funding programs for universities by the Australian Government could be targeted to areas of priority – such as scholarships and prizes, and/or it could be capped and /or have different matching rates. The Australian Government could consider a matching fund scheme that also involves the business sector in order to boost business contributions to philanthropy.
- Support for Australian universities philanthropy through enhanced funding of university R&D
The Australian Government should incentivise further private philanthropy towards Australian university research and development through:
- Enhance its “leadership giver” role with respect to the level and scope of Australian Government research funding for universities. As highlighted in the Go8 submission to the Universities Accord, this includes providing full economic cost support for government research grants and introducing National Strategic Research Block Grants to support core research. Government leadership will provide a signal to private philanthropists on the merits of contributing to Australian universities.
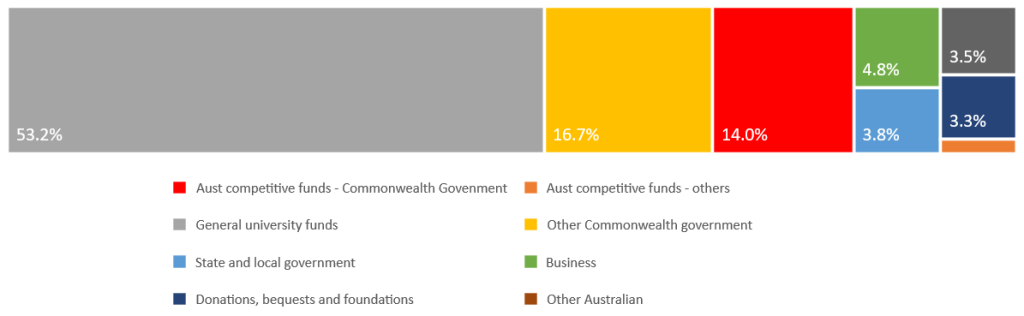
- Chart 8 shows data on Australian higher education sector R&D (HERD) income by source for 2020 (the latest year available). It shows that HERD income from Australian Government competitive grants is only 14 per cent of total income sources. Donations, bequests, and foundations income is only 3.3 per cent of total income sources. By enhancing its funding of competitive grants (which by the fact they are competitive, act as a signal of quality to private philanthropists), the Australian Government can attract further contributions from private donations, bequests, and foundations towards university research.
Chart 8: Higher education research and development sources of income, 2020, per cent of total
Source: Department of Education, Higher education expenditure on R&D (HERD) by university. https://www.education.gov.au/research-block-grants/resources/higher-education-expenditure-rd-herd-university
- Enhance the regulatory and broader taxation settings for philanthropy.
This submission has examined how broader demographic changes, such as aging of the Australian population, intergenerational wealth transfer, and growth in Australian universities alumni create an environment for further opportunities for philanthropy. Trusts and foundations are increasingly important as a source of philanthropy for Australian universities, but there is generally a lack of knowledge regarding structured giving vehicles such as Public Ancillary Funds or Private Ancillary Funds.
These factors suggest the Australian Government should review and enhance the regulatory and broader taxation settings for philanthropy. Specifically, the Go8 supports the measures advocated for by Philanthropy Australia and university advancement staff across the Go8. These include:
- Superannuation: allowing people to bequeath their superannuation savings to charities, including Australian universities, and addressing any tax disadvantages from doing so.
- Structured giving: address any impediments to Private Ancillary Funds distributing to other ancillary funds such as Public Ancillary Funds and foundations where this can enhance the impact of the philanthropic distributions.[28] Moreover, examine the application of US style later in life legacy philanthropy. For example, the “pooled income funds” in the US enable donors to receive an annual income stream from units held in the fund, as well as receive income and other tax advantages.[29]
- Timing of tax deduction claims: Using the Quebec reform, reduce the time before eligible philanthropic donations could be claimed against Australian tax. Provide taxpayers with a choice to return some or all of their tax return to DGRs such as Australian universities as part of their annual tax return.
More broadly the Go8 supports:
- Taxation settings that continue to allow access to refundable franking credits for philanthropic organisations to encourage ongoing philanthropic contributions.
- Addressing any red tape associated with the regulation and oversight of registered charities, including through the national regulator, the Australian Charities and Not-for-profits Commission.
- National philanthropy information and awareness campaign
A national information and awareness campaign would inform and educate the general public on the benefits and options for philanthropy, including making people aware about the tax deductibility of donations to Australian universities and understanding the (subsidy) value of tax deductions.
Conclusion
Philanthropy (or the lack thereof across Australia when taken as a financial instrument) is a multi-faceted issue.
The Go8 very much appreciates and thanks its generous donors. We wish there were more of them so our research, our teaching and the Australian community could benefit exponentially.
The Go8’s four recommendations to this complex area in Australia, and specifically for Australian universities, crystallises for the Productivity Commission the Go8’s view that a number of reforms are necessary if the national appetite for philanthropy is to increase and be sustained. A number of recommended reforms are already being used, with success, for example in the United States.
[1] https://www.socialventures.com.au/sva-quarterly/insights-to-grow-philanthropic-giving-for-not-for-profits/
[2] The data used in this submission focuses on financial philanthropy rather than volunteering and broader giving of time because the financial data is more readily available. The data sources include financial statements of higher education institutions and survey results that examines philanthropic giving across a sample of higher education institutions in Australian and New Zealand.
[3] Philanthropy Australia quoted in Productivity Commission (2023). Review of philanthropy: call for submissions, March 2023, p. 3.
[4] The data used in this submission relates to 39 higher education institutions that include the Go8 universities. These are higher education institutions under Table A of the Higher Education Support Act 2003 (HESA). Bond University, University of Divinity, and Torrens University are not included. Data source: Department of Education, Higher education providers finance tables, adjusted statement of financial performance, various years. Available at: https://www.education.gov.au/higher-education-publications/finance-publication#toc-overview-of-series
[5] Australian Institute of Health and Welfare (2021). Philanthropic and charitable donations, August.
[6] Council for Advancement and Support of Education (2022). CASE support of education survey: Australia and New Zealand 2022, Findings from data collected for 2019, 2020, 2021, August. The survey defines “new funds secured” as new donations/gifts received, new confirmed pledges, realised bequests, and the market value of gifts-in-kind.
[7] Ibid.
[8] Ibid.
[9] Ibid.
[10] Philanthropy Australia (2022a). Giving trends and opportunities 2022, https://philanthropy.org.au/about-us/publications/giving-trends-and-opportunities-report-2022/
[11] Australian Institute of Health and Welfare (2021). Philanthropic and charitable donations, https://apo.org.au/sites/default/files/resource-files/2021-08/apo-nid313666.pdf
[12] Stephenson, A.L., & Bell, N. (2014). ‘Motivation for alumni donations: a social identity perspective on the role of branding in higher education’, International Journal of Nonprofit and Voluntary Sector Marketing, vol. 19, pp. 176–186.
[13] CASE (2022). op. cit., p. 14.
[14] Baker, C., Barraket, J., & Elmes, A., with Williamson, A., Scaife, W., & Crittall. M. (2017). Philanthropy and philanthropists. Giving Australia 2016 report series commissioned by the Australian Government Department of Social Services. Melbourne, Victoria: Centre for Social Impact Swinburne University of Technology, The Australian Centre for Philanthropy and Nonprofit Studies, Queensland University of Technology and the Centre for Corporate Public Affairs.
[15] https://giving.uwa.edu.au/impact/our-supporters/forrest#:~:text=A%20%2465%20million%20donation%20made,philanthropic%20gift%20in%20Australian%20history.
[16] Flatau, P., Lester, L., Brown, J.T., Kyron, M., Callis, Z., & Muir, K. (2022). High net wealth giving in Australia: a review of the evidence, Centre for Social Impact: UNSW and UWA. https://doi.org/10.25916/ranq-n886
[17] Ibid.
[18] For example, a tax deduction reduces the effective out of pocket cost or price of a donation.
[19] CASE. (2004). Select government matching fund programs: an examination of characteristics and effectiveness.[20] UK Department for Education and Skills. (2004). Increasing voluntary giving to higher education: Task Force report to Government. https://dera.ioe.ac.uk/17735/1/IncreasingVoluntaryGivingReport.pdf
[21] Melbourne Institute of Applied Economic & Social Research. (2019). ‘Can tweaking tax treatment of donations support disaster relief?’. Research Insights, no. 01/19, April.
[22] Scaife, W., McDonald, K., Williamson, A., & Mossel, V. (2015). ‘Giving in Australia: philanthropic potential beginning to be realized’. In Wiepking, P., & Handy, F. (eds.), The Palgrave Handbook of Global Philanthropy, Palgrave Macmillan, pp. 488-505.
[23] Baker et al. (2017). op.cit., p. 73.
[24] Andreoni & Payne (2013). op.cit., p.21.
[25] Baker et al. (2017). op.cit., p. 69.
[26] Ibid., p. 70.
[27] Studies have shown that under certain circumstances, donors respond more to matching funding than rebates.
[28] Philanthropy Australia (2022b). Philanthropy Australia’s 2022-23 pre-budget submission. https://www.philanthropy.org.au/about-us/publications/2022-23-pre-budget-submission/
[29] FindLaw (2022). ‘Pooled income fund: a charitable trust that brings multiple returns’. https://www.findlaw.com/estate/trusts/how-to-feel-great-while-on-a-budget-pooled-charitable-trusts.html